Introduction
We live in a world where network connectivity is not guaranteed. While 5G networks are expanding across major cities, billions of users in emerging markets, rural areas, and even urban commuters still rely on 3G, LTE, or congested Wi-Fi connections.
For mobile app developers, this reality presents a specific and measurable challenge. Your app needs to perform well regardless of what the network looks like.
Yet most developers test their apps on fast office Wi-Fi or unlimited mobile plans. This creates a dangerous blind spot. One that produces thousands of poor reviews, user churn, and lost revenue when real users encounter performance failures on slower connections.
This is where network traces become your most powerful diagnostic tool. By analysing exactly what happens over the network during app execution, you can identify bottlenecks, eliminate unnecessary requests, and optimise payload sizes before they become production problems.
With QApilot's network traces feature, you can simulate real-world network conditions and gain complete visibility into every byte transferred during automated test execution.
Why Slow Network Testing Matters
The Global Reality
Recent research indicates that over 60% of mobile users worldwide access the internet on 3G or 4G networks. In India, Brazil, and Nigeria. Markets with hundreds of millions of smartphone users. Average download speeds hover around 10–20 Mbps. Add latency, packet loss, and intermittent connection drops, and the testing environment your app was built in bears almost no resemblance to what these users experience.
The consequence: performance problems that are invisible on office Wi-Fi are catastrophic on real networks. You will not know about them until users tell you through one-star reviews.
The Cost of Poor Network Performance
The impact of slow network performance is quantifiable.
- Every additional second of load time increases app uninstalls by up to 7%
- Slow apps reduce session duration by 30–40%
- E-commerce apps see 1–2% revenue loss per 100ms of added latency
- Poor performance is consistently the leading reason users abandon apps. Ahead of missing features and buggy UI
Why Traditional Testing Falls Short
Most teams test on fast Wi-Fi with unlimited data on modern flagship devices with stable connections.
Real users experience:
- Congested networks during peak hours
- Connection drops and re-connections
- Variable bandwidth that changes 10x based on location and network load
- Background processes consuming available bandwidth
- Device CPU throttling under thermal load
Network traces allow you to bridge this gap by creating a testing environment that mirrors the conditions your users actually encounter.
Understanding Network Traces
What Are Network Traces?
A network trace is a detailed record of every HTTP and HTTPS request and response that occurs during app execution. It captures request headers and body (what your app sends), response headers and body (what your server returns), timing information (when each request starts and completes), payload sizes (how much data is transmitted), status codes and errors, and connection details including protocol versions, TLS negotiation, and DNS lookups.
Why Traces Are Better Than Simple Monitoring
Basic analytics might tell you that users are experiencing slow load times. Network traces tell you why. Specifically, they reveal:
- A single poorly optimised endpoint causing cascading delays across the user flow
- Unnecessary requests being made at app startup that block the critical path
- Large image assets that could be compressed without visible quality loss
- Unoptimised API responses returning fields the app never reads
- Sequential requests that could be parallelised with no dependency changes
- Requests timing out specifically on slow connections due to generous timeout thresholds
With this level of visibility, you can make targeted, high-impact improvements rather than guessing at the source of a problem.
Using QApilot's Network Traces for Slow Network Testing
Step 1: Simulate Realistic Network Conditions
QApilot allows you to test your app under a range of realistic network conditions directly within your test execution environment:
| Profile | Download | Upload | Latency | Use Case |
|---|---|---|---|---|
| 3G | 2.5 Mbps | 400 Kbps | 400ms | Emerging markets, rural areas |
| Slow 4G | 5 Mbps | 2 Mbps | 100ms | Congested urban networks |
| LTE | 10 Mbps | 5 Mbps | 50ms | Typical mobile experience |
| Custom | Configurable | Configurable | Configurable | Worst-case / regional simulation |
Rather than assuming a network condition, you can run your critical user journeys under each profile and see exactly how performance degrades. Run your e-commerce checkout flow under fast network (baseline), LTE (typical), 3G (challenging), and 3G with 200ms additional latency and 5% packet loss (worst-case). Comparing results across these conditions reveals which parts of your flow are sensitive to network quality.
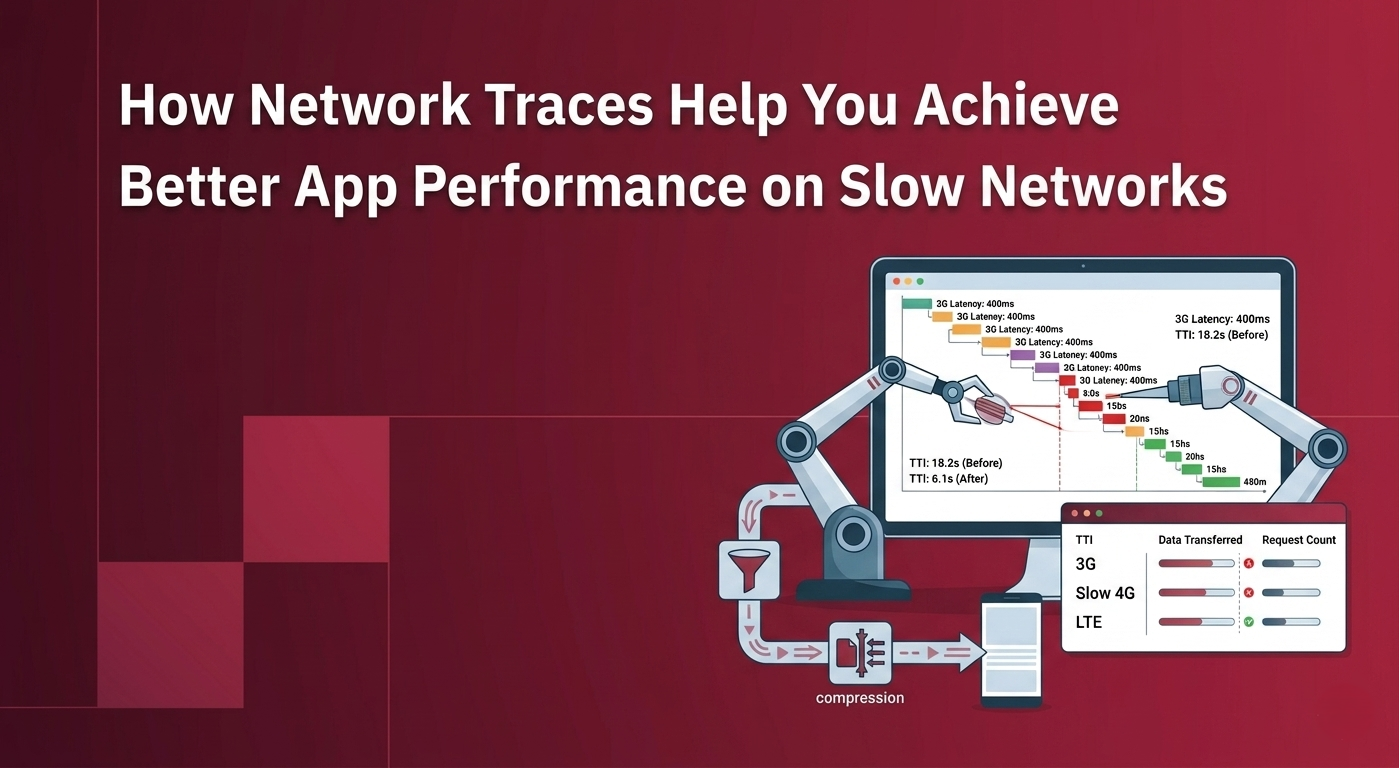
Step 2: Capture and Analyse Request Waterfalls
Network traces in QApilot display a timeline showing when each request starts and completes. This is known as the waterfall view. It is the most valuable tool for identifying sequential dependency chains that hurt performance on slow networks.
What a problematic waterfall looks like:
- Request A (0–500ms): Fetch user profile
- Request B (500–1000ms): Fetch user settings. Blocked until A completes
- Request C (1000–1500ms): Fetch recommendations. Blocked until B completes
On a fast network, this 1.5-second chain is barely noticeable. On 3G with 400ms latency, the same chain stretches to 10 seconds or more.
Parallelising these independent requests could reduce that to under 3 seconds.
Other patterns to look for:
- Large payload responses taking disproportionate time
- Excessive request count at startup (50 or more is a red flag)
- DNS resolution delays accumulating across multiple domains
Step 3: Identify Quick Wins
Network traces frequently reveal straightforward improvements with high impact:
- Unnecessary requests: Identify analytics, tracking, and secondary content calls made before the UI is interactive. Defer these until after the main experience loads
- Redundant data: Check API responses for fields the app never uses. Work with your backend team to create lightweight endpoints or accept query parameters to filter response size.
- Uncompressed assets: Verify that your server applies gzip or Brotli compression. A 2MB JSON response that should be 200KB is an immediate target.
- Missing cache headers: If the same request repeats across your test flow, verify that proper Cache-Control headers are set. On slow networks, re-downloading identical responses is an especially costly pattern.
Step 4: Measure the Impact
After making optimisations, re-run tests under identical network conditions and compare traces.
Key metrics to track:
- Time to Interactive (TTI): How long until the user can meaningfully interact with the app
- Total data transferred: Measured in KB or MB — lower is directly better on metered connections
- Number of requests: Fewer round-trips mean less latency accumulation on slow networks
- Critical path length: The total time of your longest sequential dependency chain
- Largest single response: Your biggest bottleneck
On a 3G network, an optimisation that saves 100ms on fast Wi-Fi typically saves 500ms to 1 second because of the slower serialisation of requests and reduced overall network efficiency.
Network Performance by User Journey
This matrix illustrates how load times degrade across network conditions for common app flows. Use it as a template for your own baseline measurement:
| Journey | Fast Network | LTE | Slow 3G | 3G + Packet Loss |
|---|---|---|---|---|
| Login | 1.2s | 3.5s | 8.2s | 12.5s |
| Home Feed | 2.1s | 6.3s | 18.5s | 28.3s |
| Search | 0.8s | 2.4s | 6.1s | 9.8s |
| Checkout | 3.2s | 9.1s | 24.5s | 38.0s |
Teams that measure these numbers systematically can prioritise optimisation efforts based on which journeys suffer most under the network conditions their target users experience.
Real-World Optimisation Case Study
The Scenario
A social media app was receiving one-star reviews from users in India complaining about slow performance. Testing on office Wi-Fi showed no issues. The development team had no explanation.
The Investigation
Using QApilot's network traces with a simulated 3G profile, engineers discovered three critical problems.
First, app startup made 47 network requests with a combined payload of approximately 500KB.
Second, profile image loading was entirely sequential. The app fetched the user profile, then loaded the avatar image, then fetched the friends list, then loaded each friend's avatar individually. On 3G with 400ms latency, this sequential chain took more than 30 seconds to complete.
Third, analytics and tracking requests. Five to ten additional calls. These were placed on the critical path, blocking the UI from becoming interactive.
The Solution
The team made three targeted changes.
First, they parallelised image loading. Instead of sequential requests, batch avatar requests were made simultaneously using HTTP/2 multiplexing.
Second, they implemented responsive image sizing, serving smaller images to mobile clients rather than the full-resolution versions designed for desktop browsers.
Third, they moved analytics and tracking requests off the critical path, deferring them until after the main UI became interactive.
The Results
App startup time on 3G improved from 30 seconds to 8 seconds. This is a 73% reduction.
User retention on slow networks increased 40% within two weeks.
App Store rating improved from 2.8 to 4.2 stars within a month.
The app became viable in price-sensitive markets where 3G connectivity is the norm.
None of this would have been possible without network traces revealing where the actual time was being lost.
Best Practices for Network Trace Analysis
1. Test Complete User Journeys, Not Isolated Screens
Do not trace only the login screen or the home feed in isolation.
Trace the complete flows that matter:
- Login → Home → Search → Product Details → Checkout
- Login → Feed → Like → Share → Notifications
- Open App → Sync → Browse → Download
Different journeys have different network profiles and different bottlenecks. A problem invisible on the login screen may be catastrophic in the checkout flow.
2. Test on Real Devices via Cloud Services
QApilot integrates with cloud device providers including BrowserStack, HeadSpin, and LambdaTest.
Testing on real devices is more accurate than simulators because real hardware produces real network stack behaviour, actual background process interference, and genuine thermal load.
All of these affect network performance in ways emulators cannot replicate.
3. Compare Network Conditions Systematically
Use the journey matrix approach. Run the same test under each network profile and record the outcome. This gives you a data-driven picture of where performance is acceptable and where it is not. It also lets you prioritise which bottlenecks to address first based on the networks your actual users are on.
4. Monitor Third-Party Services
Network traces reveal slow third-party APIs, advertising networks, and analytics services that your code cannot control directly. Sometimes the bottleneck is not your server. It is a CDN that performs poorly in certain regions, or an analytics provider whose endpoint times out under congestion. Identifying these dependencies lets you choose faster alternatives or implement fallback behaviour.
5. Set Network Performance Budgets
Define acceptable data budgets per screen or user flow and enforce them in CI/CD.
A practical starting point:
- Initial app load maximum 500KB total transfer
- Secondary screens maximum 250KB
- Continuous feed scrolling maximum 2MB per scroll
When traces show violations, the team has a clear signal to optimise before shipping.
6. Test Network Failure Scenarios
Do not test only the happy path of a complete, stable connection.
Test:
- Connection drops mid-request
- Partial responses
- DNS timeouts
- Server responses delayed beyond 30 seconds
These edge cases expose retry logic failures, missing loading state handling, and crashes that only occur when the network behaves unexpectedly. These are exactly the conditions real users on unstable networks encounter.
Tools and Integrations
QApilot's Network Trace Features
- Automated network throttling: built-in support for 3G, 4G, LTE, and fully custom profiles
- Real-time trace capture: during automated test execution, no additional instrumentation required
- Waterfall visualisation: see request timing and dependencies at a glance
- Detailed request and response inspection: view headers, body payloads, and exact byte sizes
- Performance metrics: TTI, FCP, and LCP automatically calculated per run
- Trend tracking: compare network traces across builds to catch regressions
- CI/CD integration: fail builds automatically when network performance degrades beyond budget
Complementary Tools
Android:
Android Studio Network Profiler for Android-specific request analysis during development
iOS:
Xcode Network Link Conditioner for slow network simulation on macOS during development
Local debugging:
Charles Proxy or Fiddler for inspecting and modifying requests during local development
Web performance:
Lighthouse for web-based app performance analysis
Integrating Network Traces into Your Development Workflow
Phase 1: Baseline Testing
Run network traces on your critical user journeys under fast, LTE, and 3G conditions.
Record:
- Load times
- Request counts
- Total data transferred
These baselines become your reference for all future optimisation work and regression detection.
Phase 2: Continuous Monitoring
Add network performance assertions to your CI/CD pipeline.
Configure builds to fail if:
- App startup time on 3G exceeds your threshold
- Total data transfer increases significantly
- New API endpoints are introduced without compression
Catching these regressions at the pull request stage is dramatically cheaper than catching them in production.
Phase 3: Optimisation Sprints
Use trace data to drive focused optimisation work.
The waterfall view identifies the highest-impact bottlenecks. Address:
- Critical path first
- Sequential request chains
- Payload sizes
Measure after each change to confirm improvement and avoid regressions.
Phase 4: Regional Testing
Before launching in a new market, test under the network conditions typical of that region. A profile that works well for European LTE may be inadequate for users in parts of Southeast Asia or Latin America where 3G is common and packet loss is higher.
Phase 5: Production Monitoring
Use APM tools and real user monitoring to observe network performance in production. Feed production insights back into your trace-based testing to ensure your test profiles remain realistic as network conditions and user behaviour evolve.
Summary
Network traces are among the most powerful tools available for improving mobile app performance on slow connections.
By moving beyond assumptions and actually measuring what happens when users on 3G access your app, you uncover insights that can transform user experience at scale.
The most successful mobile apps. Those with consistently high ratings across diverse regions. Share a common characteristic. Their teams measure network performance under realistic conditions rather than assuming it. They do not guess that their app is fast. They verify it.
With QApilot's network traces feature, you can:
- Simulate realistic slow network conditions
- Identify exactly which requests and responses cause bottlenecks
- Measure the impact of every optimisation
- Build confidence that your app performs well globally
Whether users are on 5G in a major city or 3G in a remote area, your app remains reliable.
Read next: How AI Self-Healing Tests Eliminate the Mobile Test Maintenance Crisis
Frequently Asked Questions
Q1: What are network traces in mobile app testing?
Network traces are detailed records of every HTTP and HTTPS request and response that occur during app execution. They capture timing, payload sizes, headers, status codes, and connection metadata.
In mobile testing, network traces are used to identify performance bottlenecks. Sequential request chains, oversized responses, and unnecessary startup requests degrade user experience on slow connections but are invisible on fast office Wi-Fi.
Q2: Why does slow network testing matter if my app works on Wi-Fi?
Over 60% of global mobile users access the internet on 3G or 4G networks. Performance characteristics on these connections differ fundamentally from Wi-Fi. Latency is higher, bandwidth is lower, and connections are less stable. An app that loads in 2 seconds on Wi-Fi may take 20 seconds on 3G. That 18-second difference determines whether a user stays or uninstalls.
Slow network testing reveals this gap before it reaches production.
Q3: What is a request waterfall and how do I read it?
A request waterfall is a timeline visualisation showing when each network request starts and completes during a test run. Each row represents one request. The horizontal position and length represent timing. Sequential requests appear as a staircase pattern. Each waits for the previous one to finish.
Parallel requests appear side by side and complete together.
Reading a waterfall reveals:
- Sequential dependency chains that can be parallelised
- Requests with unexpectedly long response times
- The total critical path length from first request to last response
Q4: How does QApilot enable slow network testing?
QApilot provides built-in network throttling profiles. 3G, Slow 4G, LTE, and fully custom configurations apply simulated network conditions to test execution. During tests, QApilot captures complete network traces including timing, payload sizes, headers, and connection details. The waterfall view shows request dependencies clearly. Trend tracking compares traces across builds to detect regressions. CI/CD integration allows builds to fail automatically when performance degrades. Learn more: QApilot
Q5: What are the most impactful network optimisations for mobile apps?
The highest-impact optimisations, in order of typical return, are:
- Parallelising sequential requests that have no real dependency, especially on startup
- Compressing API responses using gzip or Brotli and serving appropriately sized images
- Deferring non-critical requests such as analytics and tracking
- Implementing correct caching headers to avoid re-downloading unchanged data
- Reducing total request count by combining related API calls into batch endpoints
Q6: How do I set network performance budgets for my team?
Network performance budgets define acceptable thresholds for data transfer and load times per user flow.
A practical starting framework:
- Initial app load maximum 500KB total transfer
- Secondary screens maximum 250KB
- Continuous scrolling maximum 2MB per scroll session
For load time on 3G:
- Initial load: 5–8 seconds
- Secondary screens: 2–3 seconds
Enforce budgets as CI/CD assertions so violations block merges rather than reaching production.
Q7: Does network performance testing apply to Flutter apps?
Yes. Flutter apps make the same HTTP and HTTPS requests as native apps, and face the same slow-network performance challenges. QApilot supports network trace capture for both Android and iOS app binaries, including Flutter-compiled apps. For Flutter-specific testing considerations beyond network performance, see the QApilot for Flutter page
References
Google: The Need for Mobile Speed (2016, foundational research)
Statista: Mobile Network Coverage and Speed Worldwide
HTTP/2 Specification. IETF RFC 7540
Android Network Security Configuration. Android Developer Docs
Web Almanac: HTTP Chapter. HTTP Archive