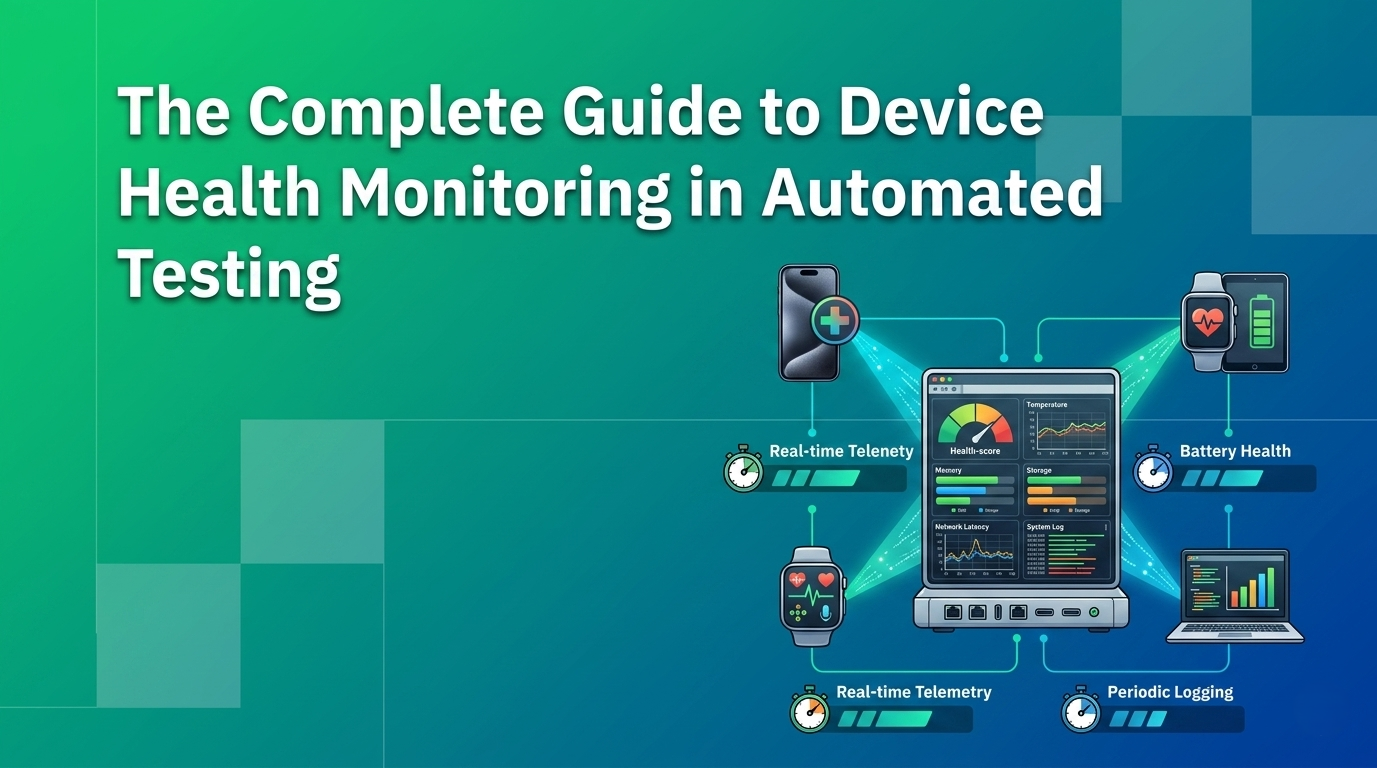
Introduction
You are running automated tests on your mobile app when you notice something strange. Tests that passed yesterday are failing today, but your code has not changed. The app crashes intermittently on some devices but works fine on others. Performance is inconsistent across test runs.
These are not app bugs. They are symptoms of poor device health.
In mobile app testing, the devices you test on are just as important as the code you are testing. A device running out of memory, throttled by heat, or starved of storage space will behave unpredictably. Battery drain, CPU spikes, and resource exhaustion do not just cause test flakiness. They mirror real user problems that will manifest in production.
Yet most testing teams overlook device health entirely. They focus on test coverage and automation infrastructure while ignoring the fundamental reality that every test runs on physical hardware with finite resources.
This is where device health monitoring becomes critical. By tracking CPU usage, memory consumption, storage availability, battery status, and thermal conditions during automated testing, you gain insight into:
- Why tests are flaky
- How your app behaves under resource constraints
- Which devices are genuinely problematic versus temporarily overloaded
- Whether your app will work on the budget devices your users rely on
- How real users with older, lower-spec phones will experience your app
With QApilot's device metrics feature, you can monitor all of these signals automatically during test execution, correlate them with test results, and make data-driven decisions about app optimisation and device compatibility.
Why Device Health Monitoring Matters
The Device Fragmentation Reality
The Android ecosystem alone includes more than 10,000 device models with wildly different specifications:
- RAM: From 2GB on budget phones to 12GB or more on flagships
- Storage: From 32GB to 512GB and beyond
- Processors: From budget Snapdragon 400-series to flagship Snapdragon 8 Gen 2
- Battery: From 3,000mAh to 5,000mAh and above
Your app needs to work across all of them. Or at least the ones your target users own.On iOS, while the ecosystem is more controlled, you still have meaningful variation. The iPhone 13 mini ships with 4GB RAM while the iPhone 15 Pro Max ships with 8GB. Thermal behaviour also differs considerably between a 2019 model and a 2024 model under sustained load.
The Hidden Cost of Ignoring Device Health
When device health is not monitored during testing, critical signals are missed. Three patterns appear repeatedly:
Tests fail intermittently on certain devices. Root cause: the device is running at 95% memory capacity, causing allocation failures. Without health data, teams blame the test framework and spend weeks debugging code that is not the problem.
App crashes only during heavy load testing. Root cause: thermal throttling at 45°C drops CPU performance by 50%. The app works in a cool test environment but crashes in user hands on a warm day.
Battery drain complaints from real users. Root cause: testing was never conducted with device battery below 20%, where background processes behave differently. The result is damaged ratings, user churn, and lost revenue.
Real Business Impact
Research indicates that device-specific issues account for approximately 35–40% of app crashes in production. Many of these are preventable with proper device health monitoring during testing. Additionally:
- Older device incompatibility drives 1–2 star reviews
- Battery drain issues rank in the top five app review complaints
- Storage-related crashes disproportionately affect budget-conscious markets
- Thermal throttling performance degradation is rarely diagnosed by users but manifests as "the app is slow"
Understanding Device Health Metrics
Device health monitoring tracks eight key metrics. Here is what each one tells you and why it matters.
1. CPU Usage (%)
CPU usage measures the percentage of processing cores being actively used by your app and system processes. High CPU usage above 80% sustained for more than a few seconds indicates your app is computationally expensive. On budget devices with fewer cores, that 80% means the device cannot handle other tasks simultaneously.
Normal ranges:
0–5% at idle, 10–30% during active scrolling and animation, 40–70% during heavy computation such as photo processing. Sustained above 80% is a problem requiring optimisation.
Red flags:
CPU remaining high after user stops interacting (often a memory leak symptom), significant CPU usage differences between identical devices, or immediate 100% spike at app launch.
2. Memory Usage (MB/%)
Memory usage tracks RAM currently allocated by your app. Apps with memory leaks slowly consume more RAM each time a screen is opened. Eventually causing the OS to kill background processes, or your app itself. High memory usage also forces the OS to swap to storage, which is exponentially slower.
Normal ranges:
30–80MB at baseline launch, 50–200MB post-feature screens, 100–400MB on heavy screens with high-resolution images. Sustained memory growth across repeated actions is a memory leak indicator.
Red flags:
Memory increasing by 10MB or more every time a user opens a screen, OutOfMemoryError crashes on any device below 4GB RAM, or memory plateauing at 90%+ of available system RAM.
3. Available Memory (MB)
Available memory measures free RAM remaining on the device. This metric captures real-world conditions, because most users have other apps running. When available memory drops below approximately 200MB, system performance degrades severely. Apps fail to allocate new objects, causing crashes. The OS becomes sluggish. Third-party apps slow down.
Target thresholds:
500MB is healthy. 200–500MB is acceptable. Below 200MB creates risk of crashes. Below 50MB puts the system under severe stress.
4. Storage Usage (GB)
Storage usage measures the space consumed by your app's files, cache, and data over time. Apps with bloated caches or poor cleanup consume gigabytes gradually. When device storage reaches critical levels, typically below 1GB free, apps cannot write logs, caches, or databases. Downloads fail. Users see "no space on device" errors.
Normal ranges:
50–200MB for a lightweight app, 200MB–1GB for media-heavy apps. Cache should stay below 500MB and be cleaned regularly.
5. Temperature (°C)
Device temperature, typically 35–45°C under normal use, is a leading indicator of thermal throttling. At 42–45°C, the OS starts limiting CPU frequency. Above 48°C, significant performance degradation occurs. Above 50°C, the device may aggressively throttle or shut down power-hungry processes entirely. Users experience this as "the app just got slow."
Red flag:
Temperature reaching above 45°C during normal scrolling means your app is inefficient. Performance degrading after five minutes of use is a thermal throttling signature.
6. Battery Level (%)
Battery behaviour changes significantly at specific thresholds. Below 20%, some devices reduce CPU performance to preserve battery. Below 10%, system processes behave differently and background activity is curtailed. The user experience on low battery is genuinely different from high battery. Most testing never covers it.
Key thresholds to test:
100% (baseline), 50% (normal sustained use), 20% (Low Power Mode on iOS / Battery Saver on Android), 10% (critical battery conditions), and below 5% (emergency conditions).
7. Battery Drain Rate (mAh/min)
Battery drain rate measures how quickly the battery discharges during app use. Excessive drain above 5mAh/min depletes a typical battery in two to three hours of continuous use. Users avoid apps with high battery consumption. Background activities such as GPS, Bluetooth, and syncing contribute meaningfully to drain and are often invisible without this metric.
Acceptable ranges:
Below 1mAh/min at idle, 2–5mAh/min during normal use, 5–10mAh/min during gaming or video, below 0.5mAh/min in background.
8. Thermal Throttling Status
Thermal throttling status indicates whether the OS is actively reducing CPU frequency due to heat. This is a direct indicator that your app is pushing the device beyond its thermal limits. When throttled, CPU performance drops 30–50%. Users cannot control this; it is OS-level protection. Throttling active for more than 30 seconds is a serious issue requiring code-level optimisation.
Key Metrics and What They Tell You
Metric Triage Guide
Use this table when a health alert fires in QApilot. Match the pattern you are seeing to identify the most likely root cause:
| Severity | Example Finding | Recommended Action |
|---|---|---|
| >80% sustained for >2 minutes | CPU-intensive feature (e.g. live filter, video) | Profile and optimise. Offload to background thread |
| +10MB per screen open across 5 iterations | Memory leak. Objects not released | Use memory profiler. Fix retain cycles or listener leaks |
| Temperature >45°C during normal scrolling | App causing thermal throttling | Reduce CPU work. Avoid continuous animation on main thread |
| Battery drain >5mAh/min at idle | Background GPS, sync, or wake locks | Audit background services. Reduce polling frequency |
| Storage growing >50MB per session | Cache not being purged | Implement cache eviction limits. Clean up temp files |
Metric Correlation Matrix
Understanding how metrics relate to each other helps diagnose compound problems:
| Scenario | CPU | Memory | Temp | Battery Drain | Likely Issue |
|---|---|---|---|---|---|
| High CPU + High Temp + Throttling | 90%+ | Normal | 48°C+ | High | App computing too much |
| Normal CPU + Memory Growing | 20% | Rising | Normal | Normal | Memory leak |
| High CPU + Normal Temp | 80%+ | 50% | 35°C | Normal | CPU-bound (e.g. video) |
| Normal CPU + High Memory | 20% | 85% | Normal | Normal | Large data structures in RAM |
| All normal on A, high on B | Varies | Varies | Varies | Varies | Device-specific (driver/OS/background) |
Real-World Example: The Mysterious Crash
Scenario: your app crashes after ten minutes of use on iPhone 13 mini but works perfectly on iPhone 15 Pro Max.
Without device health monitoring: you spend weeks debugging your code, finding nothing wrong, because the code is not the problem.
With device health monitoring, you see immediately:
- iPhone 13 mini (4GB RAM). Memory reaches 85%. App allocation fails. Crash.
- iPhone 15 Pro Max (8GB RAM). Memory only reaches 40%. No crash.
The fix: optimise memory usage or reduce feature set for lower-RAM devices.
Without health monitoring, this diagnosis might take weeks. With it, it takes minutes.
Setting Up Device Health Monitoring with QApilot
QApilot collects device metrics automatically during test execution on both iOS and Android. No additional instrumentation required. Here is the full implementation path.
Step 1: Enable Device Metrics Collection
In QApilot, device metrics are captured for every test run by default. Configuration options include sampling interval (default 100ms, adjustable), the specific metrics you want to capture, and threshold alerts that define which metric values should flag warnings in your dashboard.
Step 2: Define Your Device Test Matrix
Create a test matrix covering device diversity.
By operating system:
iOS: iPhone 13 mini (baseline low-RAM), iPhone 14 (mainstream), iPhone 15 Pro Max (premium)
Android: budget Snapdragon 400 device, Snapdragon 700 mid-range, Snapdragon 8 Gen 2 flagship
Segment additionally by:
- RAM class (2–3GB budget, 4–6GB mainstream, 8GB+ premium)
- Storage (32GB, 64GB, 128GB+)
- Device age (current, 1–2 years old, 3+ years)
QApilot integrates with cloud device providers including BrowserStack, HeadSpin, and LambdaTest, giving you access to real devices across this full spectrum.
Step 3: Establish Baseline Health Metrics
Before making changes, capture baseline metrics for each device type. A baseline entry should record:
- Average and peak CPU
- Average and peak memory
- Memory growth across five iterations
- Average battery drain
- Thermal throttling occurrence
- Storage available before and after the test
Store baselines in your test reporting system. They become your regression reference.
Step 4: Monitor Device Health During Critical Journeys
Focus monitoring on the user flows that matter most.
Examples:
- E-commerce app: browse catalogue, view product details, add to cart, complete checkout
- Social media app: feed load and scroll, image/video upload, comment thread, story creation
- Productivity app: document creation, rich text editing, file sync, collaboration features
For each journey, correlate health metrics with frame rates, interaction responsiveness, and test pass/fail status.
Step 5: Set Performance Budgets
Define acceptable ranges for each metric by device category and enforce them automatically:
Budget devices (2–3GB RAM, Snapdragon 400):
- CPU max 70% sustained
- Memory max 150MB
- Battery drain max 5mAh/min
- Temperature max 45°C
- Storage growth max 50MB per session
Mainstream devices (4–6GB RAM, Snapdragon 700):
- CPU max 75% sustained
- Memory max 250MB
- Battery drain max 4mAh/min
- Temperature max 46°C
- Storage growth max 100MB per session
Premium devices (8GB+ RAM, Snapdragon 8 Gen 2):
- CPU max 80% sustained
- Memory max 400MB
- Battery drain max 3mAh/min
- Temperature max 47°C
- Storage growth max 150MB per session
In your CI/CD pipeline, configure tests to fail automatically when metrics exceed these budgets.
Step 6: Correlate Metrics with Test Results
This is where real insights emerge. In QApilot's reporting, you can see the relationship between device health state and test outcomes. For example, the same test passing at 45% memory, failing at 78% memory, and passing again at 52% memory. That pattern points directly to memory pressure as the cause of flakiness, rather than a code bug.
Step 7: Generate Device Health Reports
Create visibility into device health trends over time. Weekly reports should surface which devices had the most health issues, which tests consistently trigger high CPU or memory, thermal throttling incidents, and battery drain trends. Per-build reports should show whether health metrics improved or degraded with the latest changes. Device category reports should highlight whether budget devices are performing within acceptable thresholds and where optimisation is most needed.
Real-World Optimisation Case Study
The Scenario
A fitness app was receiving crashes on budget Android devices. Specifically the Redmi Note series with 3GB RAM. It worked perfectly on flagship devices like the Samsung S24 with 12GB RAM. The development team could not reproduce the crash on their own devices.
The Investigation
Using QApilot's device metrics on a Redmi Note with 3GB RAM during workout tracking, the team observed:
- Memory usage at 210MB with only 290MB available
- Memory growing at +15MB per minute
- Peak temperature at 46°C with throttling active
- Average CPU at 80%
The pattern was clear. The app was continuously allocating location data, sensor data, and UI widgets faster than garbage collection could reclaim them. As available memory approached 200MB, the OS began killing background processes, and eventually terminated the fitness app itself.
The Solution
The team made three targeted changes:
- Reduced in-memory history. Instead of keeping the entire workout history in RAM, only the current session and the last seven days were cached. This reduced memory usage by 80MB.
- Implemented incremental garbage collection. Cleanup was triggered during idle moments instead of allowing allocations to accumulate.
- Reduced GPS update frequency from 100ms to 500ms. This cut both CPU load and memory allocation rate.
The Results
Before optimisation:
- Crashes on 3GB devices affected 5% of users
- Memory usage: 210MB with 290MB available
- Crashes occurred every 20–30 minutes
After optimisation:
- Crashes on 3GB devices fell below 0.1%
- Memory usage dropped to 95MB with 620MB available
- No crashes in a three-hour stress test
Business impact:
- Overall app crash rate dropped 40%
- Device compatibility expanded from 70% to 95% of Android devices
- One-star reviews mentioning crashes dropped from 8% to below 1%
- Monthly revenue increased by 15%
None of this would have been achievable without device health monitoring revealing the actual problem.
Best Practices for Device Health Monitoring
1. Monitor the Right Devices
Do not test exclusively on flagship hardware. Your users include budget device owners. Test on at least one budget device per OS (2GB RAM), at least one mainstream device (4–6GB RAM), and at least one premium device (8GB+). The budget device consistently reveals issues that flagships never surface.
2. Create Realistic Load Conditions
Device health metrics matter most when testing realistically. Do not clear memory before tests. Let devices operate as real users experience them, with background apps consuming resources. Test on devices that are nearly full, not freshly formatted. Explicitly test at below 20% battery. Test after the device has warmed up, not only from a cold start
3. Separate Device Issues from App Issues
When a test fails on Device X but passes on Device Y, device health data helps you distinguish between a device-specific issue (hardware bug, driver problem, temporary contention) and an app issue (excessive resource usage, failure to handle low memory gracefully, assumption of high-end hardware capabilities). If only one device fails and system-level metrics are anomalous while app metrics are normal, it is likely device-specific. If all budget devices fail with similar CPU and memory patterns, the problem is your app.
4. Track Device Health Trends
Create dashboards showing CPU usage, memory usage, battery drain, thermal throttling frequency, and device crash correlation across releases. If metrics worsen with each release, you are heading toward a production incident. Catching the trend early is dramatically cheaper than responding to a crash wave.
5. Test Device Health in CI/CD
Integrate device metrics into your automated test pipeline so that a code change which increases CPU by 20% is caught before it ships. Configure threshold assertions as part of your test job so that budget violations are treated as build failures, not optional warnings.
6. Correlate Health with User Experience
Track the relationship between device health metrics and test outcomes: do tests with high CPU fail more often? Does memory growth cause subsequent tests to fail? Does thermal throttling correlate with frame rate drops significant enough to affect users? This correlation tells you which metrics actually matter for your specific app and which are noise.
7. Document Device Health Requirements
In your app's technical documentation, specify minimum RAM requirements, storage requirements including cache expectations, thermal throttling behaviour during sustained use, and battery drain estimates per hour. This helps users understand what devices can run your app effectively, and reduces support volume from incompatible hardware.
Tools and Integrations
QApilot's Device Metrics Features
- Automatic collection: metrics captured during every test without additional instrumentation
- Real device testing: works on actual devices via BrowserStack, HeadSpin, and LambdaTest
- Granular insights: CPU, memory, storage, battery, and temperature all tracked
- Threshold alerts: fail tests automatically when metrics exceed your performance budgets
- Historical trending: track metric changes across releases to catch regressions early
- Correlation analysis: see which health metrics correlate with test failures
- CI/CD integration: automate health checks as part of every build pipeline
Complementary Tools
Android:
Android Profiler (Memory, CPU, Network, Energy tabs), systrace for frame timing, Battery Historian for battery analysis.
iOS:
Xcode Instruments (Memory, CPU, System Trace), Xcode Memory Debugger, Energy Impact metrics.
Analytics:
Firebase Performance Monitoring, New Relic Mobile, DataDog APM.
Quick Reference: Pre-Ship Device Health Checklist
Before shipping your app, verify:
- CPU usage below 75% on budget devices during normal use
- Memory usage below 200MB on 2–3GB RAM devices
- No memory leaks detected (memory stable over repeated actions)
- Thermal throttling not occurring during normal use
- Battery drain below 5mAh/min during normal use
- Storage usage capped. Cache does not exceed 500MB
- Available memory never drops below 200MB
- Temperature stays below 45°C during normal use
- All critical user journeys pass on budget devices
- Device health metrics integrated into CI/CD pipeline
- Device health dashboard created and monitored
- Performance budgets defined by device category
- Baseline metrics established for regression detection
Summary
Device health monitoring is not optional for teams serious about mobile quality. It is the difference between shipping apps that work on 60% of devices versus 95%, between fixing crashes in production versus catching them in testing, between wondering why budget device users are unhappy versus knowing exactly what is wrong.
By monitoring CPU, memory, storage, battery, and thermal metrics during automated testing, you gain visibility into how your app behaves on real hardware under real constraints. You catch resource leaks, inefficiencies, and compatibility issues before they reach users.
QApilot handles the heavy lifting automatically. The investment is minimal. The returns are substantial: better app quality, broader device compatibility, higher user satisfaction, and better business outcomes.
Read next: How Network Traces Help You Achieve Better App Performance on Slow Networks
Frequently Asked Questions
Q1: What is device health monitoring in mobile testing?
Device health monitoring is the practice of tracking physical device metrics. CPU, memory, storage, battery, and temperature are monitored during automated test execution. It reveals why tests fail, how apps behave under resource constraints, and whether your app will work for users on older or lower-spec hardware. Without it, flaky tests and production crashes on budget devices are often misdiagnosed as code bugs.
Q2: Why do tests fail on some devices but not others?
Device-specific test failures are most commonly caused by resource constraints invisible without health monitoring. A device running at 95% memory capacity causes allocation failures. A device thermally throttled to 50% CPU speed produces timing-dependent failures. A device with near-full storage cannot write test fixtures. Device health metrics reveal which of these conditions applies, turning "mysterious flaky test" into a diagnosable, fixable problem.
Q3: What are the most important device health metrics to monitor?
The eight essential metrics are: CPU usage (%), memory usage (MB/%), available memory (MB), storage usage (GB), temperature (°C), battery level (%), battery drain rate (mAh/min), and thermal throttling status. CPU and memory usage identify computational and allocation problems. Available memory catches system-level pressure. Temperature and throttling status reveal efficiency issues under sustained load. Battery and drain metrics expose background process problems.
Q4: How does QApilot handle device health monitoring?
QApilot captures device metrics automatically during every test run on both iOS and Android. No additional instrumentation is required. Teams configure sampling intervals, select which metrics to track, and define threshold alerts that automatically fail tests when metrics exceed performance budgets. Reports are tied to specific app versions, enabling regression tracking across releases.
Q5: What is thermal throttling and how does it affect testing?
Thermal throttling is the OS-level mechanism that reduces CPU frequency when device temperature exceeds safe thresholds, typically around 45–48°C. When throttling is active, CPU performance drops 30–50%. In testing, this means performance results collected in a cool environment will not reflect real-world usage on a warm day or after extended use. Monitoring temperature and throttling status during test execution exposes this issue early.
Q6: How do I set performance budgets for different device categories?
Performance budgets should be defined per device class, not as a single universal threshold, because hardware capabilities differ.
A practical starting point:
- Budget devices (2–3GB RAM): CPU max 70%, memory max 150MB, battery drain max 5mAh/min
- Mainstream devices: CPU max 75%, memory max 250MB
- Premium devices: CPU max 80%, memory max 400MB
Enforce these budgets as CI/CD assertions so violations block builds instead of reaching production.
Q7: How is device health monitoring relevant for Flutter app testing?
Flutter apps face device health constraints similar to native apps. CPU pressure from rendering, memory allocation from widget trees, and thermal load from sustained animations all affect performance.
QApilot supports both Android and iOS app binaries, including Flutter-compiled apps. For Flutter-specific testing considerations, see QApilot for Flutter